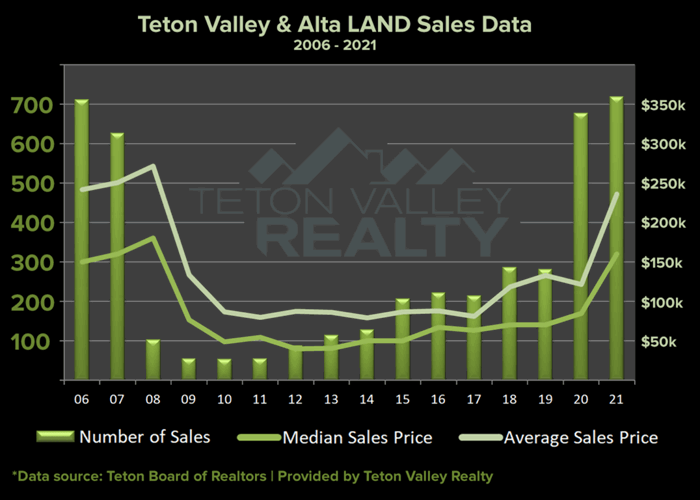
It’s that time of year again and it’s always fun to see the data. A friend suggested I prepare this in a graph style format. Naturally, I researched data from 2006 to date. For those of you reading the article as opposed to my blog or newsletter, you can probably already picture the trajectory of that graph from a high point in 2007, a low point in 2009, stagnation from 2010 to 2014, slow but increasing improvement to 2019, followed by a sharp increase in 2020. Here are my takeaways;
2008: There were 102 sales in 2008 compared to only 55 sales in 2009. Interestingly, things fell off later in the year, seeming to lag behind the rest of the Nation’s real estate trends.
2009-2012: The official recession had long been over by 2012, though land hadn’t seen much improvement in terms of the number of sales or the average sales prices during this time. These are the years with opportunities we likely won’t ever see again. I don’t attribute all of 2020’s massive gains to the usual pandemic related craze, I have always believed that land was too cheap for too long in the area.
2013-2018: This was the slow recovery stage I mentioned. It’s almost silly to think that any portion of the real estate market was still recovering this long after economic decline, but still, land prices were far cheaper than large tract land acquisition and development costs. As a result, inventory dwindled despite a huge oversupply that was attributed to the long-lasting “bargain” period.
Q1 2019 vs Q1 2020: In order to get a bit more quantifiable data I actually ran this report December 1st through March 1st (I didn’t want the pandemic in March of ’20 to impact this observation) and found that 2019 saw 37 sales with an average sales price of $188,896. One sale during that time at $3m had a big impact on that average, the median sales price was $72,000. 2020 saw 52 sales with an average of $73,064 and a median sales price of $59,000. I found it interesting that the number of sales for that quarter increased in 2020 but the median sales price decreased. For those of you looking at the graph and seeing the average sales price dip in 2020, this is likely due to the large aforementioned $3 million dollar sale that boosted that average just prior. With both land and residential the opportunity for a bargain post-pandemic before the real estate market took off was extremely short-lived. There were a few deals to be had during that time, but not many.
2021: Most real estate agents with a close ear to the ground will tell you that they feel the land market has peaked and things have stabilized as of the time of this writing, end of 2021. When looking at the data by quarter, the median sales price was Q1: $145,000, Q2: $150,000, Q3: $175,000 and Q4: $173,500. Obviously still some growth in there (until Q4), but nothing Earth shattering like we’ve been seeing.
Final Takeaway: A final interesting point should include sales prices in 2007 versus today. Interestingly, what they were nearly 15 years ago. In addition, we’ve seen 15 years of inflation and one of the hottest real estate markets in recent history. The bottom line? I believe real estate prices are currently where they should be. Bargain? No. Overvalued and otherwise a bad deal? In my view, no.